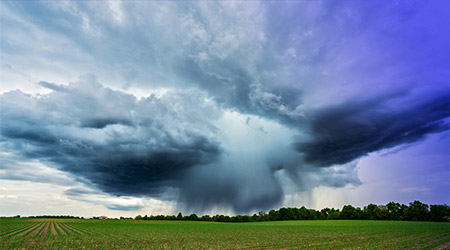
The numerous disasters that have become a part of our everyday life can be classified as natural (such as floods, hurricanes, or tsunamis) and those caused by man. Flood risks are considered one of the most critical hazards for Polish citizens, as conformed by data from the Government Centre for Security. According to figures, between the year 1990 and 2010 floods caused as much as 98.5% of losses incurred as a result of natural disasters[1]. By way of example: even though one of the most recent floods (the 2010 flood) that occurred in Poland covered only 2% of Polish territory, it caused significant losses. The results were as follows: 800 schools destroyed, 18 thousand private buildings affected and 1,300 business premises damaged[2]. Furthermore, due to climate change, it is anticipated that floods will double in frequency in the upcoming decades. Thus, floods will soon become the most dangerous natural disasters with the greatest potential for damage and harming people. In recent years, the greatest emphasis has been placed on the development and implementation of advanced technologies aiming at providing citizens with the best possible security.
SAR – a helping hand in the time of flood
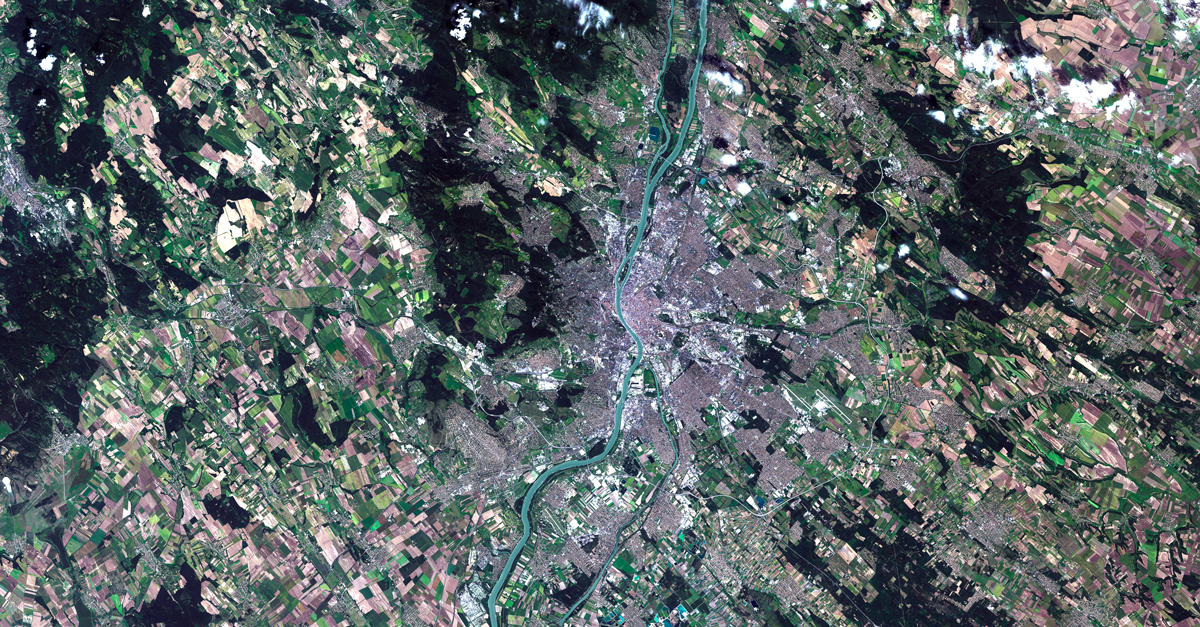
JSAR (ang. Synthetic Aperture Radar) satellite technology can prove useful in the process of assessing the consequences of a flood. The principle of the system’s operation consists in placing an imaging instrument on a satellite platform and flying over a selected area in order to “scan” it with the use of radar waves. Due to the fact that SAR imaging allows for using the radar not only in daylight, but also at night, when it is raining, cloudy, foggy or the air is full of smoke and dust, it is widely used in various fields of science[3].The radar instrument sends radio waves in the indicated direction and then measures how they are reflected. These kinds of instruments are used primarily to project images of the land surface (soil moisture, distinguishing rock types, flood monitoring) as well as by the military aviation for terrain reconnaissance[4].
Taking all these circumstances into consideration, one of the most important objectives of protection against flood risk is obtaining early, real-time warning information about emergency situations[5]. Such probabilistic predictions are possible if we decide to deploy SAR imaging technology. The SAR image recorded by a given system is a so-called microwave hologram, which, when a rather complicated visualization process is completed, becomes a radar image. Each single pixel in the radar image contains information regarding the amplitude and phase of the signal returning to the antenna. The value of this data may change in successive satellite flybys, due to the distance between the satellite and the object, the time-dependent changes occurring in the analysed object and the inhomogeneities of the atmosphere. It is worth remembering that the value of the amplitude registered for any pixel of the radar image depends to a large extent e.g. on roughness of the analysed surface and soil moisture[6]. All in all, due to the frequent co-occurrence of flooding with heavy clouds, radar imaging presents itself as an attractive observation technique when the use of optical methods seems practically impossiblee[7].
Contrast sets the boundaries
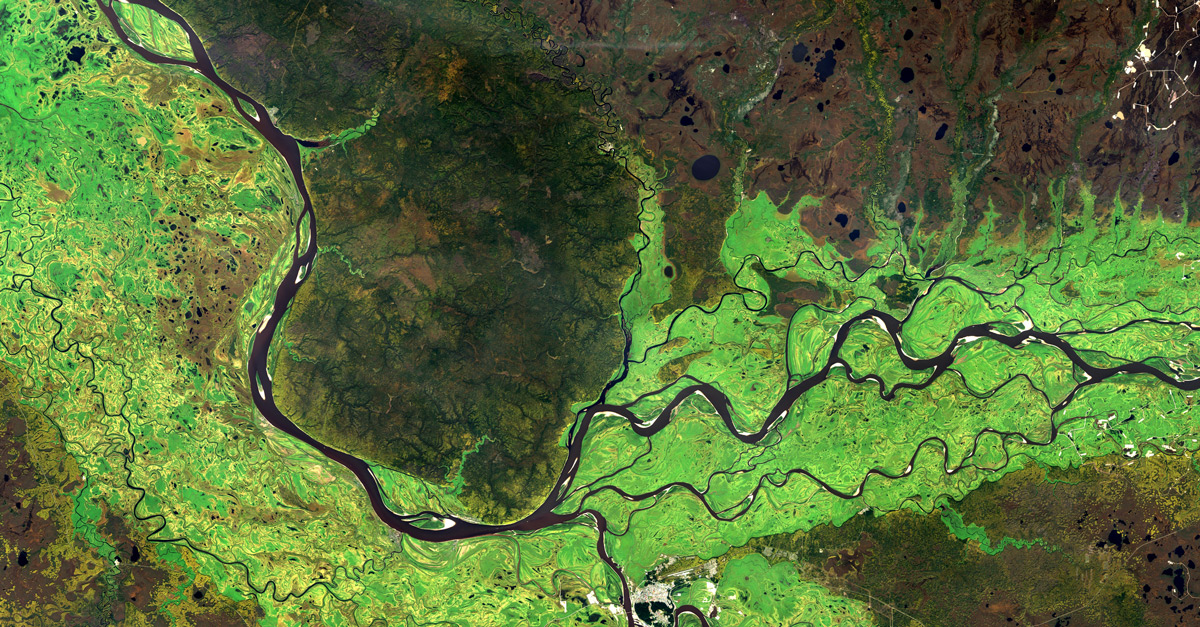
Observation of flood dynamics involves primarily identification of partially (including those obscured by vegetation) or entirely flooded areas. In general, the detectability of water in SAR images depends on the contrast between flooded areas and the surrounding land, therefore, the value of the measurement can be influenced by roughness of the surface, wavelength, angle of incidence and polarization. The simplest case is a smooth sheet of water, which in the vast majority of images is displayed simply as a black surface. This is the result of specular reflection of radiation in the direction opposite to the radar and a deficiency in the backscattering component[8]. The following figure illustrates what the scattering mechanisms of water and land surfaces look like under different environmental conditions and what the scattered radiation components look like as a function of angle of incidence between SAR and surface roughness.

All these limitations may result in the so-called false alarms; factors that can lead to misclassification of floods are indicated in the table below:
| Flood overestimation | Flood underestimation | ||
| Factor | Occurrence/impact | Factor | Occurrence/impact |
| Effects of a shadow behind vertical objects (e.g. vegetation, topography, anthropogenic structures) | +++ | Effects of a shadow behind vertical objects (e.g. vegetation, topography, anthropogenic structures) | +++ |
| Naturally smooth surface features (e.g. dunes, salt and clay basins, bare soil) | +++ | Naturally smooth surface features (e.g. dunes, salt and clay basins, bare soil) | ++ |
| Smooth anthropogenic features (e.g. streets, airstrips) | ++ | Anthropogenic features on the water surface (e.g. ships, debris) | + |
| Torrential rain cells | + | Loss of water surface smoothness by wind, heavy rain or high flow velocity | + |
| The effect of overlay on vertical objects (e.g., urban structure topography, vegetation) | + | ||
Range: high +++; medium ++; low +
Source: S. Marinis, C. Kuenzer, A. Twele, “Flood Studies Using Synthetic Aperture Radar Data,” (in: P.S. Thenkabail (ed.), Remotely Sensed Data Characterization, Classification, and Accuracies, Volume 3, p. 148
In order to make the most accurate measurements of areas covered by partially submerged vegetation, it is necessary to use radar signals operating in three bands: L band (wavelength equal to 30-15 cm), C band (wavelength 7.7-3.75 cm) and X band with wavelength equal to 3.75-2.5 cm[9]. The longer the waveform, the less sensitive it is to surface roughness. Additionally, if the water surface is not affected by the wind, the backscattering component is stronger, which leads to misclassification of water areas as terrestrial territories. However, such cases can be reduced to a minimum by using HV cross polarization or HH horizontal polarization, and by using a larger imaging angle[10].
SAR and urban areas
Urban areas are another environment where flood detection is strongly reduced, especially in comparison to rural areas. Reflection from anthropogenic structures (such as buildings) and the presence of metallic surfaces cause backscattering that is identical for flooded and non-flooded surfaces. In addition, shadows and illumination reduce visibility, which in turn reduces the ability to detect urban leakages. In addition, non-flooded roads and other smooth man-made structures often cause erroneous readings due to mirroring and are difficult to separate from smooth water surfaces.
In such harsh environments, it is therefore difficult to perform accurate terrain surveys based on imaging alone, which is why high-resolution SAR data, such as TerraSAR-X data processing, is used to increase the accuracy of analyses. It is a fully automated water mapping tool that uses a fuzzy logic based algorithm to combine SAR backscatter information with digital information about elevation, slope and water body size[11].The system uses data on the area before the flood, and then automatically analyses all the changes that occurred on the relevant territory. A numerical terrain model is a source of information regarding potential directions of water mass movements. The land/water separation is created by automatically thresholding the pixel values that are present in the amplitude images. The whole process of flood monitoring consists in synthesizing various information with the use of complex mathematical methods[12]. As far as the actual improvement of the observation accuracy through application of relevant technology is concerned, during the tests, measurements based on data processing increased the measurement accuracy from 20.9% to 82.4% and from 51.7% to 83.7%, respectively[13].
[1] Karol Mąka „System ochrony przeciwpowodziowej w Polsce”
[2] Presentation “Satelitarny System Obserwacji Ziemi”
[3] Mgr inż. Jędrzej Jakub Drozdowicz – project “Trójwymiarowe obrazowanie radarowe z syntetyczną aperturą wykorzystujące optymalizowaną, złożoną trajektorię ruchu nośnika radaru”
[4] pl.wikipedia.org/wiki/Radar_z_syntetyczną_aperturą (accessed on: 26.04.2021)
[5] Sat4envi, Satellite data for public administration, p. 311
[6] Stanisława Porzycka-Strzelczyk, lecture “Teledetekcja w ochronie środowiska”, AGH University of Science and Technology
[7] Sat4envi, Satellite data for public administration, p. 316-317
[8] Sat4envi, Satellite data for public administration, p. 317
[9] Konrad Nering, “SRTM – technologia obrazowania powierzchni Ziemi”, Cracow University of Technology
[10] Sat4envi, Satellite data for public administration, p. 317
[11] S. Marinis, C. Kuenzer, A. Twele, “Flood Studies Using Synthetic Aperture Radar Data,” (in: P.S. Thenkabail (ed.), Remotely Sensed Data Characterization, Classification, and Accuracies, Volume 3
[12] Sat4envi, Satellite data for public administration, p. 318
[13] S. Marinis, C. Kuenzer, A. Twele, “Flood Studies Using Synthetic Aperture Radar Data,” (in: P.S. Thenkabail (ed.), Remotely Sensed Data Characterization, Classification, and Accuracies, p. 155